How to Measure Retail Display Success
If you’re overseeing large-scale merchandising rollouts, you already know retail success can’t be measured by design alone. The real value lies in how these displays drive behavior and conversions.
From measuring retail sales metrics and customer engagement to planogram compliance and ROI, we walk through how top brands are evaluating the impact of their point of purchase (POP) programs.
Sales Performance Metrics
The most common indicator of a display’s success at retail is whether it increases product purchases. To measure sales performance, there are multiple metrics brands can study.
Sell-Through Rate
Often represented as a percentage, this term refers to how quickly your product is selling compared to its inventory level. For instance, if a store carries 100 units of your product and sells an average of 50 a month, your Sell-Through Rate (STR) is 50 percent.
Monitoring this rate can reveal performance trends that correspond with the launch of your retail display program. If the STR climbs, it suggests your product is moving faster off the shelf, indicating the display is likely contributing to that velocity.
Sales Uplift
While the STR focuses on how quickly a product moves relative to available inventory, Sales Uplift tracks the revenue impact.
This retail sales metric assesses how effective your displays are at influencing consumer purchasing behavior by comparing the average sales results before and after your POP program.
If your average sales volume increases after deployment, that’s clear evidence your in-store marketing campaign is working.
Average Transaction Value
Are shoppers purchasing higher-value products from your display? Measuring the Average Transaction Value (ATV) will tell you.
While typically calculated at a store level by dividing total sales by the number of transactions, ATV can also be isolated for retail displays by dividing the total sales of display products by the number of transactions involving display-only purchases.
This value reveals how well your POP program influences spend on high-ticket items and gives your brand insight into how the product placement, pricing, and cross-selling strategies are contributing to the display’s retail success.
Units Per Transaction
Measuring the Units Per Transaction (UPT) determines the average number of items purchased from the display in a single transaction.
Quantifying this metric shows if cross-selling efforts are working, whether the display encourages impulse buying, if promotions are effective, and if you need to reassess your mix of products showcased.
UPT alone can’t tell you what is being bought, so a higher UPT with low-value products might not yield the revenue lift you’re after. Pairing UPT with ATV will give you more well-rounded insight into the profitability of your retail display.
Customer Engagement and Interaction Metrics
Retail sales metrics can assess the success of your retail display program monetarily, but there are other factors that help you measure whether store displays are resonating with customers.
Dwell Time
Dwell time, or the amount of time a shopper spends in proximity to a display, is often cited as a “must-track” KPI, but the practicality and cost of doing so at scale can be limiting for many brands.
Usually seen as a way to determine customer interest, engagement, and purchase intent, it’s commonly measured through technology like AI-powered cameras, motion sensors, heat mapping, and RFID tracking.
Sometimes high-level tech like this can be out of a brand’s price range or abilities, though. In cases like this, they can rely on factors like manual observation studies, surveys, and more.
In the end, while Dwell Time is a great metric to gauge interest, brands might prioritize other behavioral KPIs to determine retail success.
Engagement with Interactive Features
Because expensive technology like heat mapping and RFID tracking isn’t always feasible, a more accessible way to track engagement is through interactive elements like digital screens, QR codes, or physical buttons.
These engagement tools offer useful information – from click-thru rates on QR codes to the number of presses on a button – that give insights into display usage and interaction.
If budget doesn’t allow for expensive componentry to measure dwell time, data from interactive features can serve as a practical alternative for assessing shopper behavior patterns.
Planogram Compliance
Does your brand sell products across multiple retailers or locations? Consistency is key when deploying retail displays across sites and can affect purchase and engagement rates.
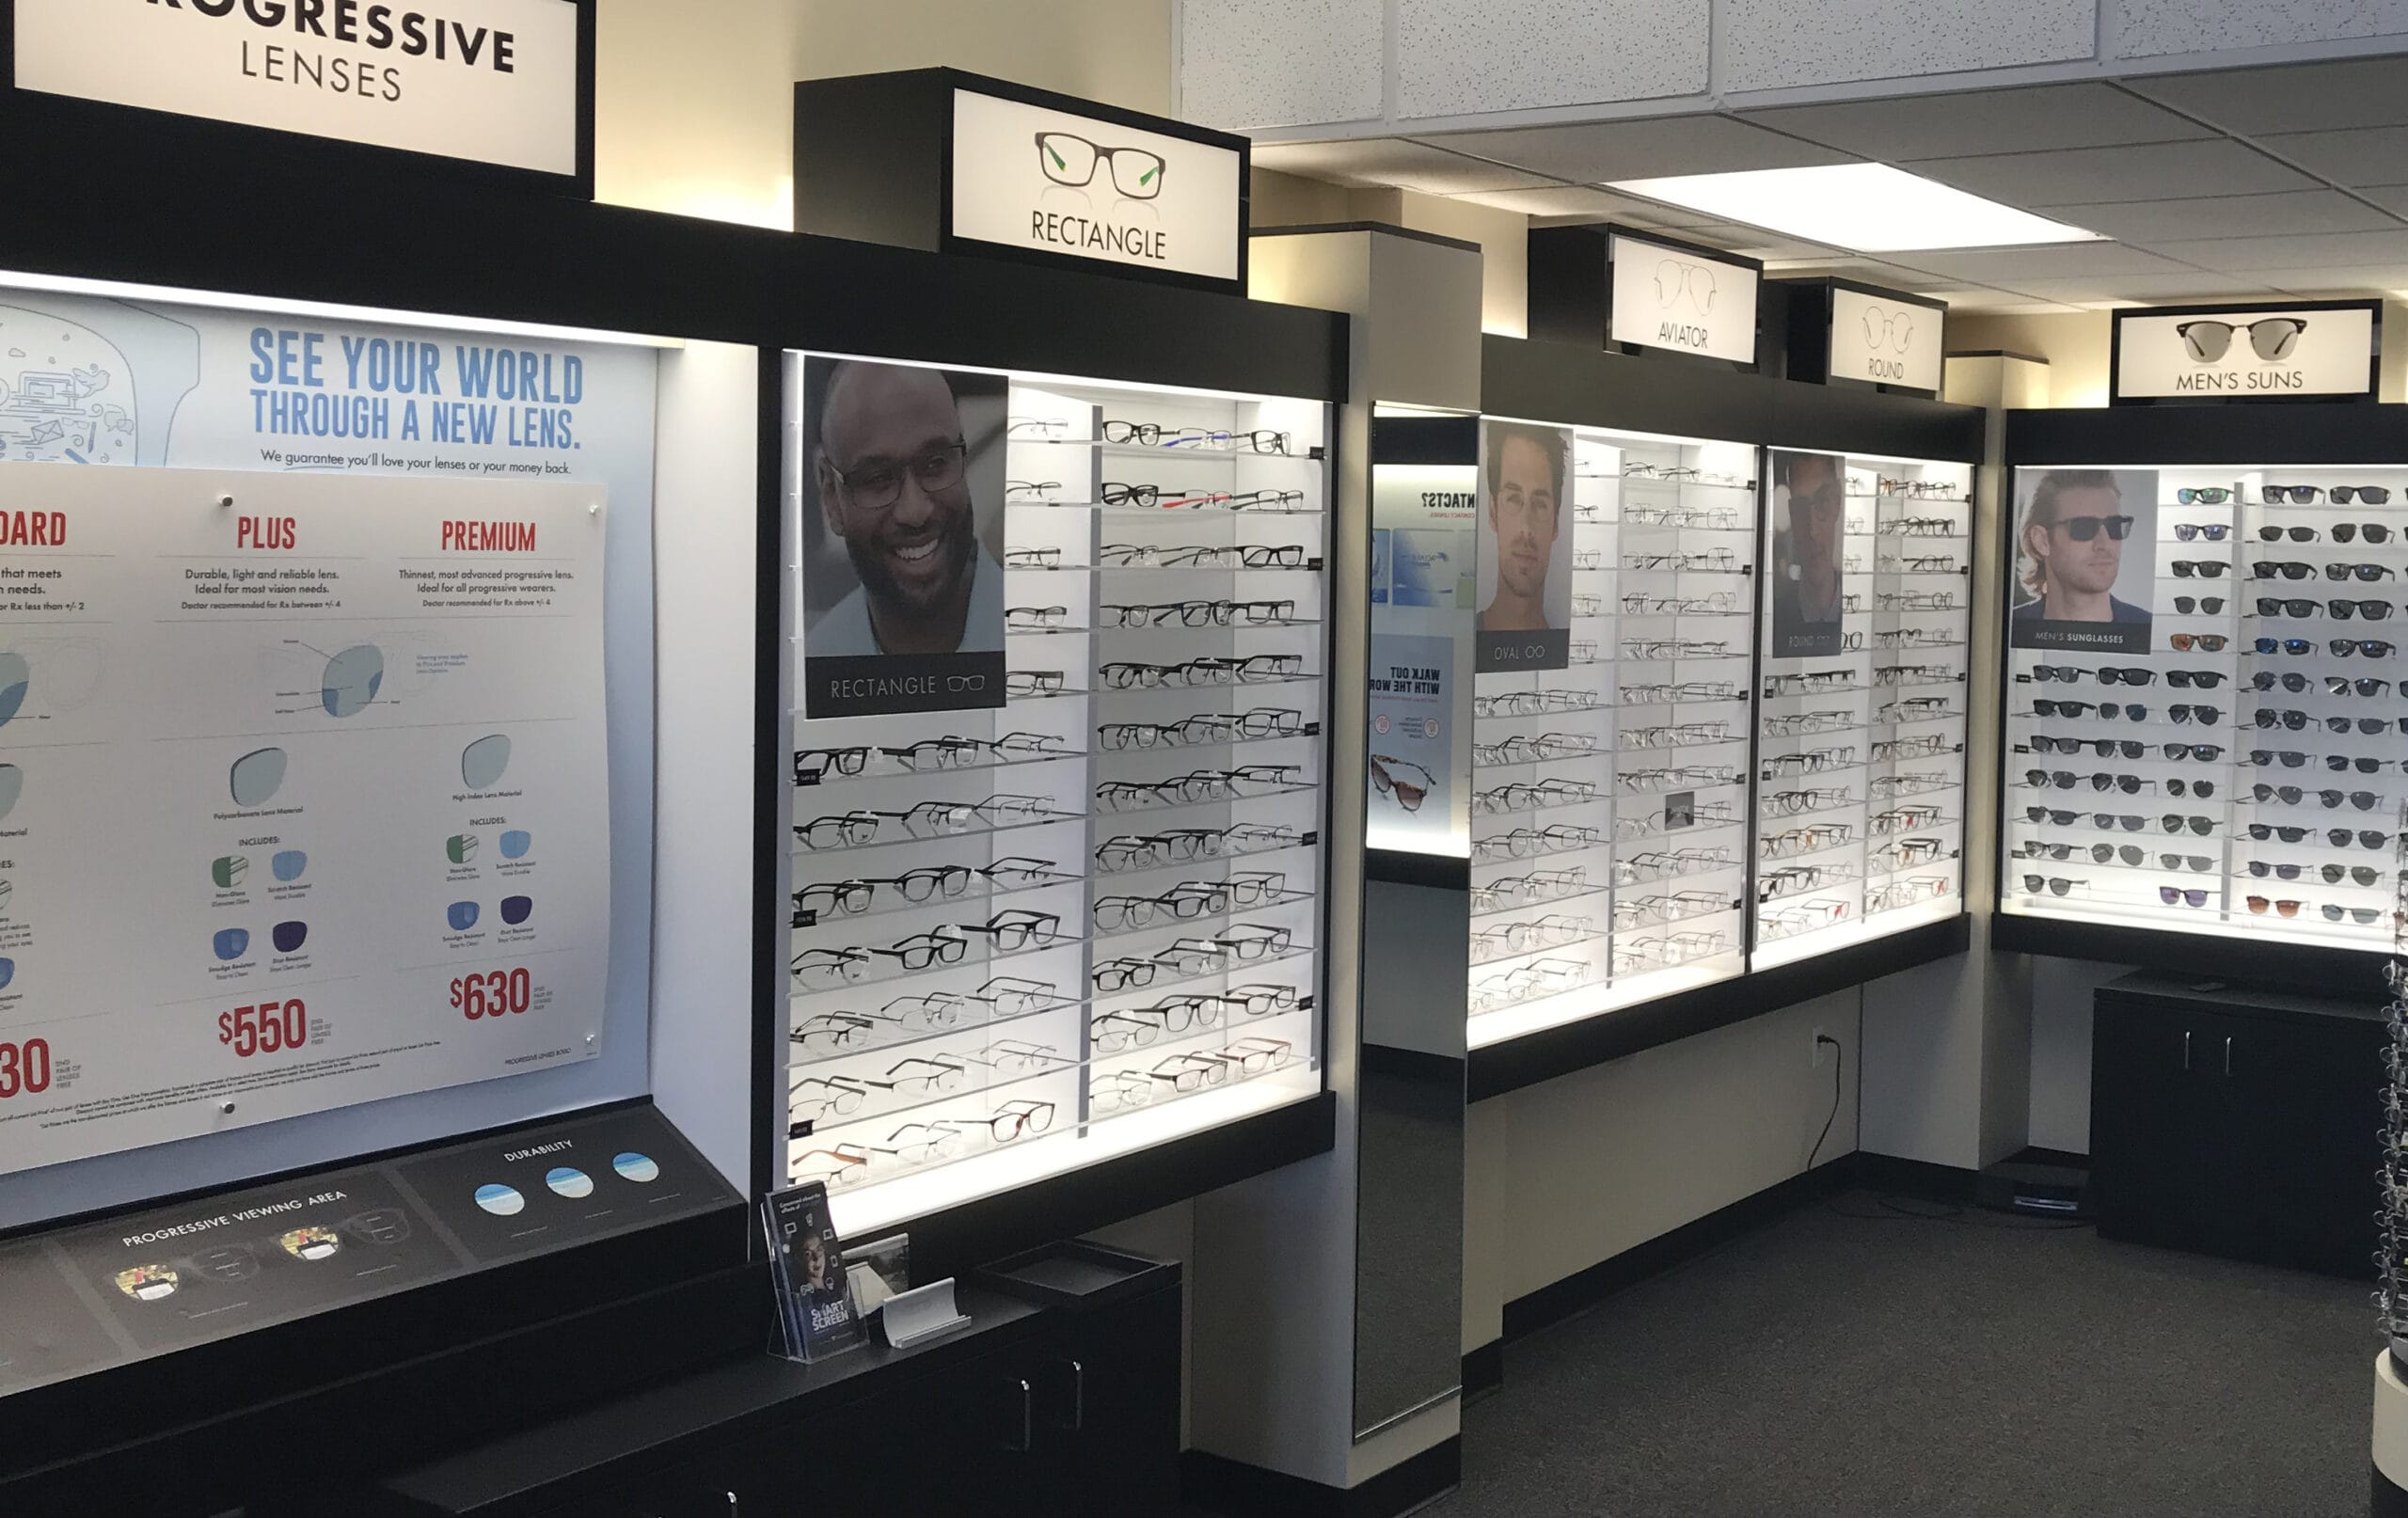 Tracking planogram compliance will help you ensure your displays are set up to be most effective, especially when research went into the original design and product configurations.
A Planogram Compliance Score measures how closely store locations follow a display plan. Most often, this is determined through store audits, carried out in-person by brand reps, brokers, or third-party merchandising firms. However, some brands also opt for the retailer self-reporting or invest in mystery shopper audits.
Complying to a display planogram can be a big concern for product manufacturers since there’s risk of displays not being set up properly or even at all.
“If stores don’t have their own installers, we often recommend a third party install team to set up the displays,” says Sandy Berman, Vice President of Retail Merchandising at Frank Mayer. “These teams then take pictures, providing proof the display was set up correctly.”
At the end of the day, monitoring planogram compliance supports brand consistency, drives shopper engagement, and ensures your strategic display designs are executed to ensure retail success.
Return on Investment
Ultimately, every merchandising display program should contribute positively to the bottom line, and factoring in the program’s costs, product sales, and length of the time in the field will help you calculate the Return on Investment (ROI).
“The bottom line is ROI,” asserts Steve Langsdale, Vice President of Sales at Frank Mayer. “Permanent displays usually take longer to generate a return on investment, depending on if the product is a higher ticket item or not, but with the displays being in the field two to five years – or even more – they more than pay for themselves.”
To determine your program’s ROI, download our popular white paper that includes a Return on Merchandising Investment calculator.
Conclusion
A great display does more than look good. It drives retail success. By tracking the right metrics, from sales lift to shopper interaction, and more, brands can connect design to real performance.
We’re experts at custom, large-scale retail display programs. Are you considering adding them to your merchandising plan? Check out more information about our programs, then contact us here.
